Advanced Excel for Finance Professionals
Excel is still among the most popular applications in finance. Still, most people do not realize that the difference between simple knowledge and a professional understanding is even greater than it may seem. Junior analysts have learned exactly how to get to the level of doing the necessary job, a SUM formula in this case, a simple VLOOKUP in that, but without the level of understanding that would enable them to work more quickly, construct models that are more reliable, or solve complex analytical problems with confidence. To prospective mid-level professionals who aspire to reach senior positions, such a difference stands out even more, especially when they are vying against other candidates seeking a job at an investment bank, a private equity firm, an asset manager, or in any corporate finance-related position where speed and accuracy matter.
This article is specifically crafted for finance students who are interested in going beyond the fundamentals. It includes the fundamental skills that make advanced Excel work for finance-oriented users: Organized model creation, advanced formulae, dynamic data management, and scenario analysis. These are not abstract methods, but rather the abilities that make a model pass under a CFO or raise eyebrows with an auditor, four hours or forty minutes to a piece of analysis, and a professional to be viewed as an asset of technical skills or one that requires hand-holding. These principles are typically taught in a rigorous advanced Excel course in finance, but in this case, they are adapted for use in a wide variety of real-world situations.
The requirements of finance functions today are increasing: more data, shorter times, and more advanced investor and management expectations. Excel has evolved to meet these requirements, adding Power Query, dynamic array functions, and improved connectivity to external data sources. Professionals with such newer abilities, not just the traditional functions of the older versions of Excel, are actually more productive. And while Python and other solutions are increasingly relevant, Excel remains the lingua franca of finance in the majority of organizations around the world. Developing it to have true depth is thus not a specialization in its own right; it is a fundamental professional investment.
Designing Models That Hold Up Under Scrutiny
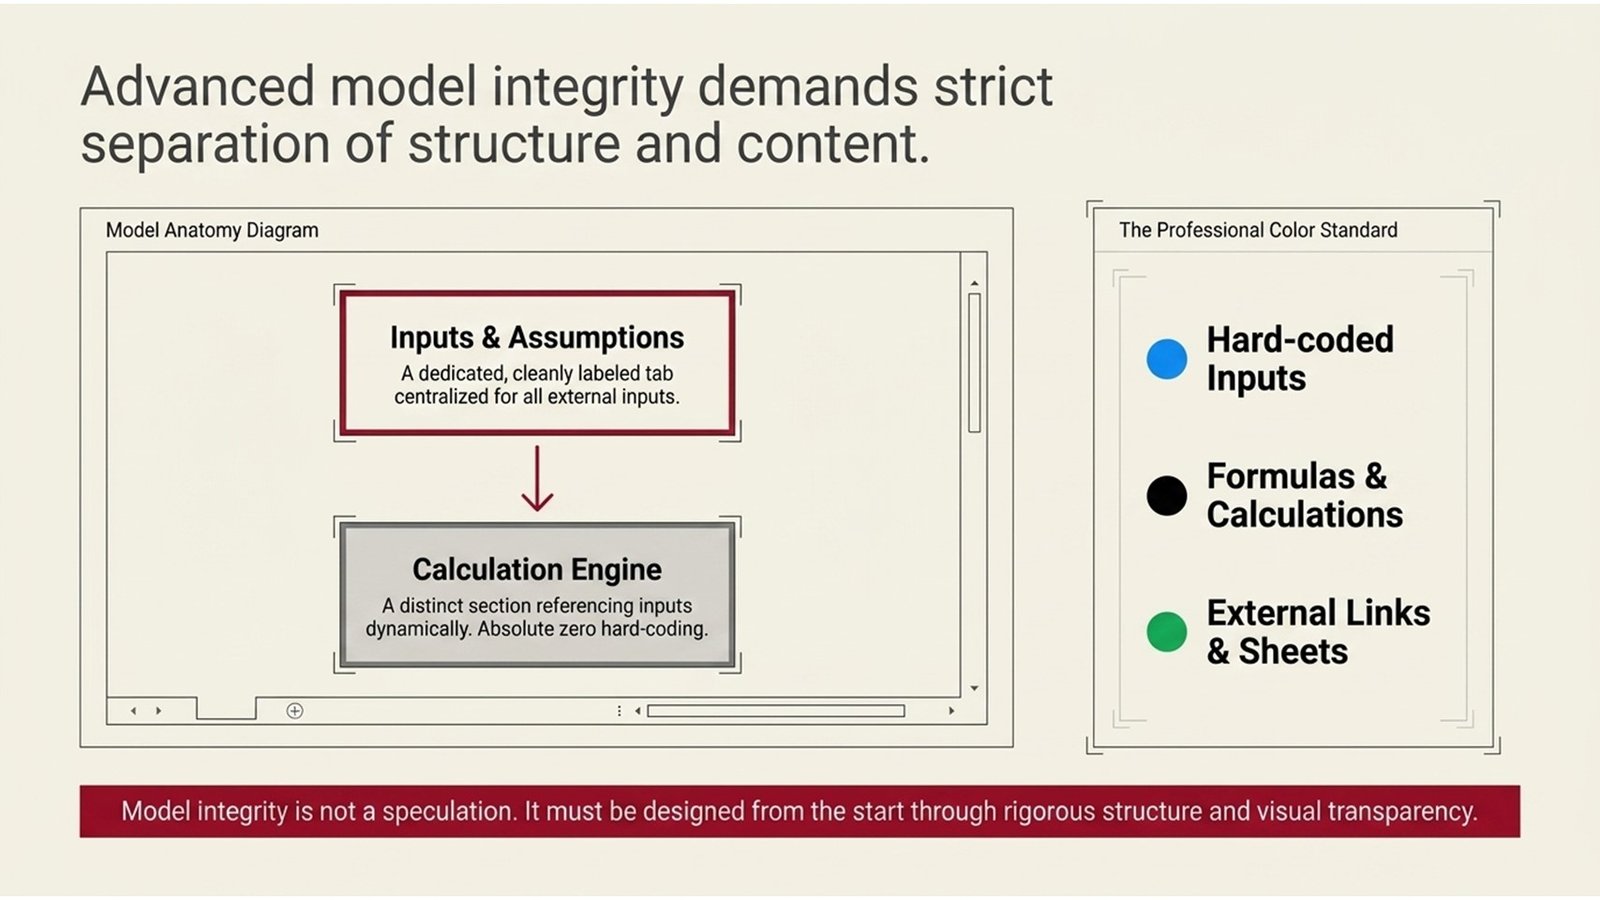
Separation of structure and content is the most significant and single habit in advanced work in Excel. This implies that inputs are to be stored in identically labeled, color-coded cells, usually residing in a special tab of its own, with calculations being stored in a distinct section that references the inputs using the cell labels. Among the most frequent errors in financial models is hard-coding numbers into formulae; this is also one of the most harmful: not only does it render such models hard to audit, easy to corrupt, and virtually impossible to stress-test effectively, but it also makes them almost impossible to stress-test efficiently. A properly designed model is transparent. Anyone with some knowledge of Excel ought to be able to open it and understand the logic in a few minutes.
Consistent structure implies consistent formatting conventions as well. In professional finance settings, it is customary to use blue for hard-coded inputs, black for formulas, and green for links to other sheets or external sources. Row and column consistency – making the items in the same line appear in the same position in all years or situations makes the model readable and minimizes the errors in the formula. These conventions might appear to be cosmetic decisions; however, they do have a tangible effect on the speed at which errors are identified and the degree of confidence with which a model can be introduced to the senior audience.
A lesson of experience in the field: models that appear clean on the surface can be highly misstructured below the surface. A mid-sized manufacturer was the focus of a European private equity firm that had performed due diligence, and it was revealed that the financial model of the target firm had pegged its working capital assumptions to hardcoded revenue numbers of a previous version – a minor structure defect that had been overlooked in various internal audits. This mistake had led to a material overstatement of forecast free cash flow. The moral is that model integrity cannot be a matter of speculation but must be built in from the beginning through rigorous design and regular peer review.
Mastering the Formulas That Finance Actually Uses
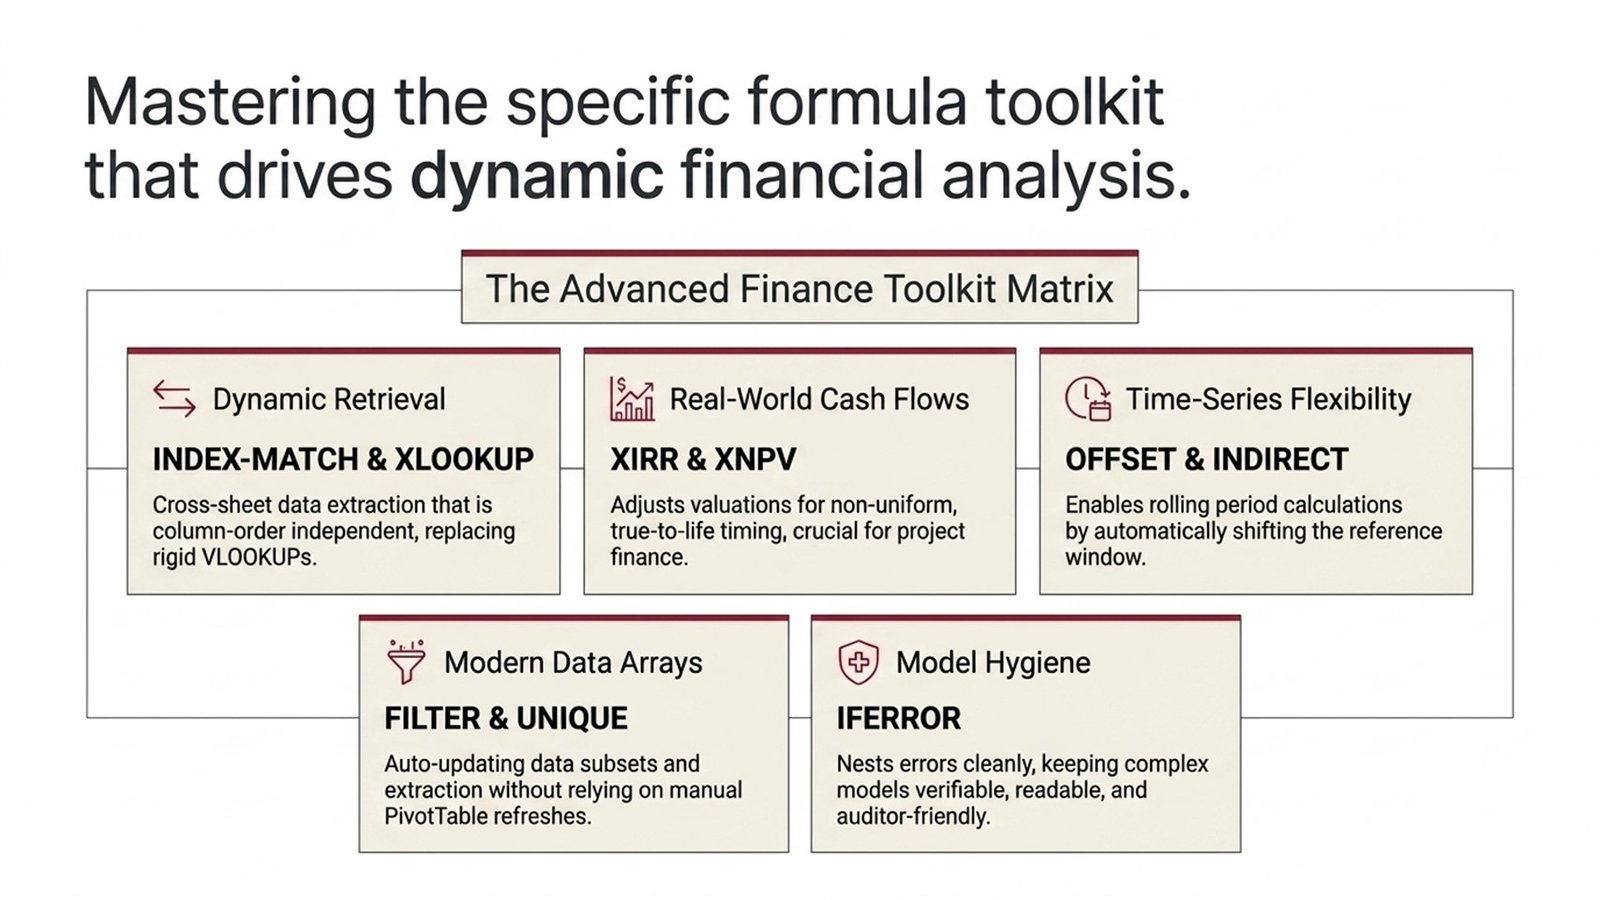
The set of functions in Excel that are of disproportionate importance in finance work has its share, and mastering their truly productive use cannot be considered a more immediate payback than the time invested by a professional. The most significant of them is INDEX-MATCH, much more versatile and reliable than VLOOKUP, as it will enable you to access any data in any column of the range, not be limited by the order of columns. INDEX-MATCH appears everywhere in a financial model, with numerous related tables, and understanding how to nest it in IF or IFERROR statements makes models much stronger.
OFFSET and INDIRECT are two functions that enable dynamic referencing – the capability to construct formulas that move their point of reference, depending on the value in another cell. They come in especially handy when you need to compute the rolling period (that is, you have a formula that automatically looks at the past twelve months that you can use at any given time of the year). Any work that requires an irregular timing of cash flows requires XIRR and XNPV since the standard IRR and NPV functions assume periods that are spaced evenly, which is hardly the case in project finance, private equity, and real estate transactions. Anyone studying advanced corporate finance courses will encounter these functions repeatedly, because they underpin the quantitative rigor expected in professional valuation and deal analysis.
The array functions of the traditional Ctrl+Shift+Enter arrays, as well as the new dynamic array functions of Excel 365 (FILTER, SORT, UNIQUE, XLOOKUP), are an important enhancement to analytical power. Filter specifically will enable analysts to filter subsets of data by using various criteria without pivot tables or manual sorting. XLOOKUP is a single function that supersedes VLOOKUP and HLOOKUP by providing a more generalized function that is able to perform approximate matching, reverse lookup, and error handling in one go. They are not advanced because it makes them complicated, but they do speed up the analysis and make models more maintainable.
Table 1: Core Excel Functions for Finance Professionals
| Function | Primary Use in Finance | Key Advantage |
| INDEX-MATCH | Table-to-table dynamic data retrieval. | Column-order independent, large datasets. |
| XIRR / XNPV | Abnormal cash flow value. | True-to-life timing of non-uniform periods. |
| OFFSET | Rolling period calculations | Automatically changes the reference window. |
| XLOOKUP | Cross-sheet data lookup | Substitutes VLOOKUP/HLOOKUP for a single function. |
| FILTER / UNIQUE | Dynamic data extraction | No pivot table needed; auto-updates |
| IFERROR | Nesting errors in formulae. | Maintains models that are hygienic and verifiable. |
Five Steps to Building a Finance-Grade Excel Model
The next five steps are a systematic way of developing Excel models that are of the quality that would be required in the professional finance setting, whether it be in-house reporting, a deal analysis, or even a presentation of the progression to the investors. These measures are based on the best practices found in the higher Excel finance course models, and hands-on practice in both corporate and investment finance positions.
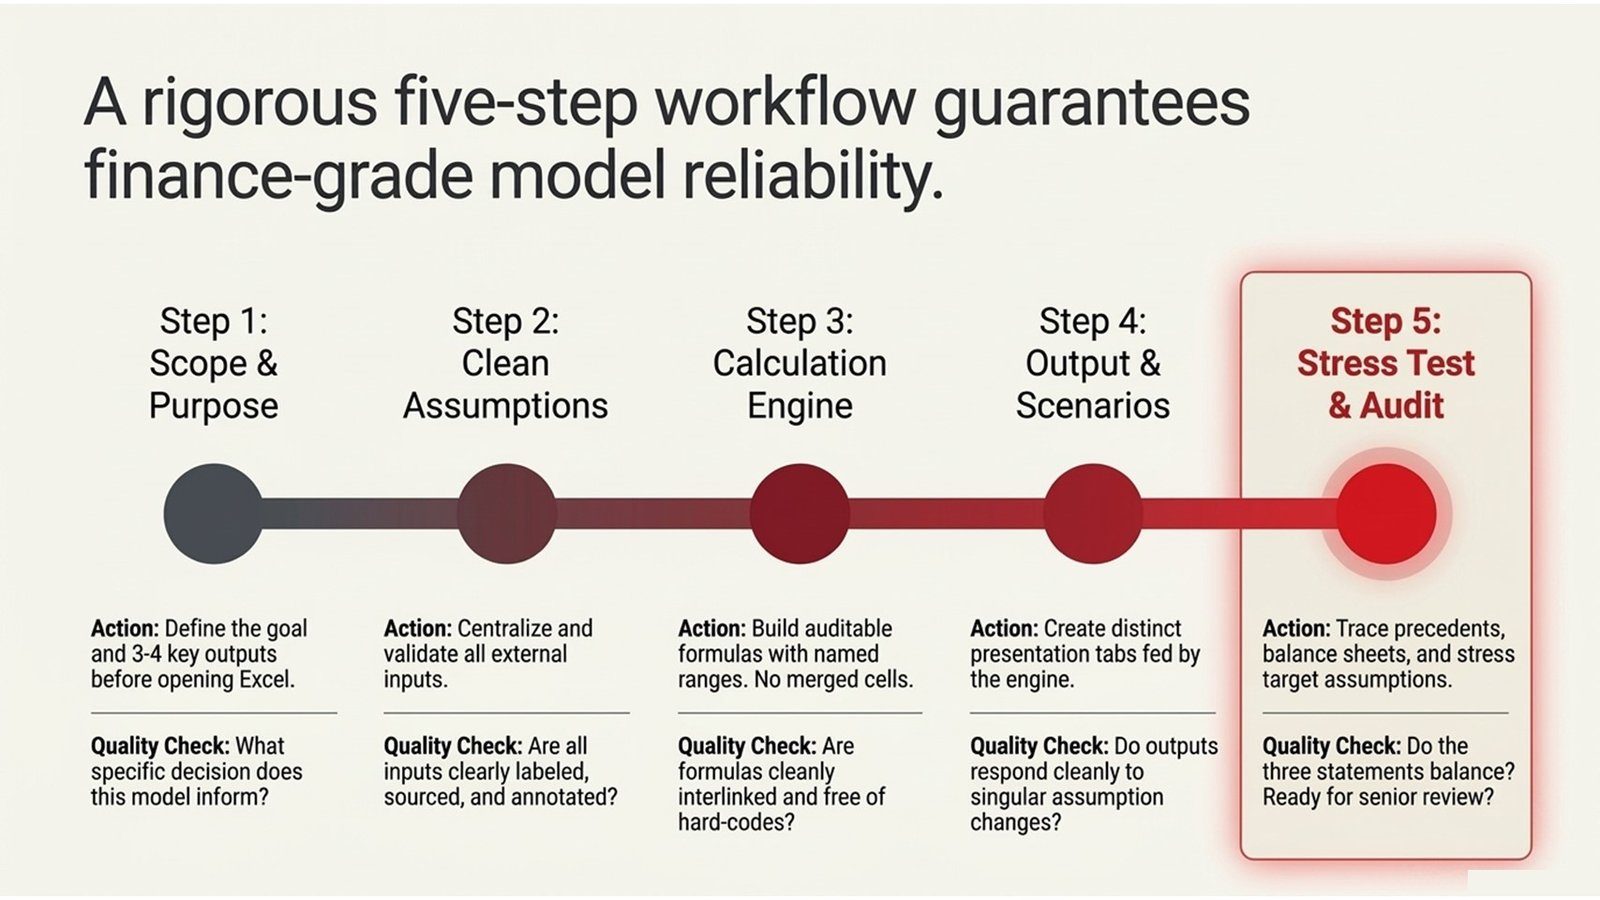
The first step is to determine the purpose and outputs of the model, and build nothing before any purpose or output is determined. The most prevalent cause of the unwieldiness of finance models is that they have been constructed without a definite end in mind. Prior to opening Excel, list the answer to the following questions: what decision is this model going to inform, who is going to use it, and what are the three or four important outputs. This will determine the extent of the model and will not allow the build-up of unnecessary tabs and calculations that slow everything down. The second step is to create an assumptions page that is clean. All the external inputs- the rate of revenue growth, inflation of costs, capital expenditure, tax rate, etc., should be placed in one location, which is well labeled. Where necessary, use data validation to avoid invalid entries and record the origin of each assumption or why an assumption was made in a cell next to it using the comment or note feature in Excel.
The third step is to develop the calculation engine based on the same, auditable formulae. Don’t have merged cells in places of calculation – it messes with copying formulas and may break structured references. Key inputs that will be used often should be used in named ranges; this makes the formulas easier to read, as well as easier to audit. The fourth step is to develop your output and scenario views as distinct tabs, which are fed by the calculation engine instead of being calculated. This isolation will make sure that your outputs are consistent with the underlying model and that you can do scenario analysis by simply altering assumptions at a single point.
The fifth step is to stress test and audit the model and then share it. Trace Precedents and Trace Dependents functions of Excel: Check formulas are being used to refer to the right cells. Complete a simple balance sheet test: do you have an equal balance sheet asset position to a balance sheet liability position plus equity position in all periods? Is there a reconciliation between the opening and closing cash balance in your cash flow statement? Does it make sense to you to test the outputs by stressing specific assumptions? A model that passes these tests is one that you could present comfortably.
Table 2: Finance Model Build Process Flow
| Step | Action | Quality Check |
| 1 | Specify purpose, scope, and major outputs. | In one sentence, what is the goal of the model? |
| 2 | Develop a well-organized assumptions page. | Are the inputs labeled, sourced, and validated? |
| 3 | Build up the calculation engine. | Are formulas regular, interlinked, and code-free? |
| 4 | Construct output and scenario displays. | Are outputs clean with respect to changes in assumptions? |
| 5 | Stress test, reconcile, and audit. | Are the three statements even? Are there logical outputs? |
Power Query, PivotTables, and the Modern Data Layer
Power Query, an in-built data transformation utility in Excel, has been one of the most important innovations in the last ten years and is enabling users to reach, clean, and transform data using many sources without writing a single formula. Power Query is groundbreaking to the finance professional who must work with big data on a regular basis, in the form of expense reports, transaction logs, general ledger extracts, etc. You don’t need to format and clean data manually every month; with just a single click, you can create a query and update it. This is the only thing that can save hours per reporting cycle, and almost any manual error that infiltrates when data is cleaned manually will be eliminated.
PivotTables are still one of the most effective analytical tools of Excel that are underutilized since analysts are not always aware of their versatility. A properly built PivotTable has the ability to condense tens of thousands of rows of transaction data into a neat management report within a few seconds. They can be used together with PivotCharts and slicers to create interactive dashboards to enable a non-technical user to explore data without having to manipulate the underlying model. This is especially useful to finance experts who provide business partners or management teams with support: it can cut down on the requests for ad hoc data since stakeholders are able to answer their own questions.
An actual case study of the practical effect is as follows: the finance department of a mid-sized Australian consumer goods company was taking four regional systems to consolidate sales information into a single master management report, taking about three days each month. Once a Power Query solution was deployed that automatically pulled and manipulated data on each source, the process time was cut to less than two hours – allowing the team to use the rest of their time on analysis and commentary as opposed to data assembly. This type of productivity increase is precisely that which distinguishes between finance teams that are considered to be strategic partners and those that are considered to be administrative functions. It is also a fundamental competency that is taught in any serious advanced Excel for finance curriculum.
Table 3: Power Query vs. Manual Data Processing
| Dimension | Manual Process | Power Query Approach |
| Time per cycle | 3-5 hours of hand-formatting. | 15–30 minute refresh |
| Error risk | High – copy-paste and manual operations. | Low — steps of transformation are fixed. |
| Repeatability | Rebuild or test on a cycle basis. | Same logic refresh with one click. |
| Scalability | Gets smaller as the size of the data swells. | Processes data of large sizes. |
| Auditability | Hard to follow footprints. | All the transformation steps are recorded. |
Scenario Analysis, Dashboards, and Presenting to Decision-Makers
One of the most obvious differences between intermediate and advanced finance professionals is the possibility of constructing scenario and sensitivity analyses directly in Excel and the capability to visually represent the results in a clear, visually effective manner. The Data Table feature of Excel (under What-If Analysis) enables you to automatically create one-way and two-way sensitivity tables, which display how a target output varies as a grid of input values. This is much more effective than having to simulate numerous manual cases, and is the default of most professional financial models. Coupled with conditional formatting, tables of sensitivities can be packaged in a visual sense – high values being darker than low ones – and it becomes straightforward to present a non-technical audience with the scope of the results s a single glance.
One of the areas that a number of technically competent analysts underinvest in is the dashboard design. A model that gives the right results, but shows them in a haphazard, unorganized manner, does not have any credibility by the time the numbers have been read. There are several simple rules of effective finance dashboards: a small palette of colors (two or three colors only), alignment of charts and tables to a standard grid, types of charts should match the data (bar charts to compare, line charts to trend, waterfall charts to analyze variances), and clear and concise labeling without over-annotation. The teaching of these principles in advanced courses in corporate finance is not taught as a matter of taste but rather as a matter of communication that has an impact on the action or inaction of analysis.
A handy case study is an example of a telecommunications firm in North America, whose FP&A department had developed a very detailed rolling forecast model that technically was excellent, but in practice was not utilized by top management. The model created printouts of twelve pages that were filled with tables that required much financial literacy to be interpreted. Once the output layer had been redesigned as a one-page interactive dashboard with four key metrics, two scenario comparison charts,s and one variance waterfall, the management started paying significant attention to the forecast. The CFO started discussing the forecast at all board meetings not due to the fact that the underlying model was altered, but that the resulting output has been redesigned to communicate instead of displaying data. This is the real sense of advanced Excel for finance: not only technical expertise, but how to apply that expertise to make informed decisions.
Table 4: Scenario Model Refresh Process Flow
| Phase | Activity | Responsible |
| Assumption Update | Update data in the assumptions tab with new data. | Analyst |
| Scenario Toggle | Selection scenario to target case (base / downside / stress) | Analyst |
| Calculation Review | Make sure that the related outputs are up-to-date. | Analyst |
| Output Refresh | Recalculate pivot tables and charts that have been connected to the calculation engine. | Analyst |
| Narrative Layer | Commentary on update in accordance with scenario insights. | Senior Analyst / Manager |
| Distribution | Output share tab or dashboard; input lock tab to recipients. | Manager / Finance Lead |
Conclusion: Actionable Insights for the Working Finance Professional
A high level of Excel skills will be among the best-paying skills that a finance employee can acquire, since the skills compound on all his or her work. A quicker, cleaner, more trustworthy model will save time on all projects, minimize the likelihood of errors that can be expensive, and develop a professional image of origin and reliability. The methods discussed herein – structured model design, formula fluency, Power Query, scenario analysis, and dashboard communication are the essence of what a serious advanced Excel course in finance should provide, and what professional finance environments are increasingly looking at as a standard.
Auditing of your existing working practices is the first step to take. Take your most-utilized models and pose the question: do they separate inputs and calculations? Do formulas contain hard-coded numbers? Could the logic be followed without being guided by you by another analyst? The responses to these inquiries will literally lead to where you ought to focus your development effort. The second is to dedicate time to the features and tools that you are not currently proficient at using, especially XLOOKUP, dynamic arrays, and Power Que,ry by using them in your actual work instead of practice tasks. It is more permanent and quicker to learn when it is used to solve a real problem.
Third, learn to create output layers that have an audience, rather than simply a personal output layer. Whenever you come up with an analysis in Excel, you should question yourself about who will be reading and what decision will be supported. Allow this question to influence the format, the amount of information you provide, and the aesthetics of your sharing. Fourth, when you consider structured learning, see processes that combine Excel methodology with financial theory – the formulae work is incorporated into underlying real-life modeling problems such as LBO analysis, DCF analysis, or budget consolidation. This is what takes technical ability and turns it into professional capability through this integration, which is provided in high-quality, advanced corporate finance courses.
Finally, it is not that an advanced Excel user in finance is concerned with being familiar with all functions in the application. It is regarding creating models and analyses that are both trusted, effective, and useful to you, to your team, and to the decision-makers who are dependent upon your efforts. The latter standard is not out of reach, and the way to it is not as difficult as it may seem: consistent design principles, intentional practice of formulas, and an unyielding quest to make it clear in communication. Finance professionals who are at Invesco will shine, and they will tend to advance.